Help Article
Understanding the Forecast Chart
What the Amolino forecast number means, how forecast categories work, and how to read the best case, worst case and forecast chart.
The Amolino forecast panel at the top left of the Forecast dashboard shows how much revenue you're likely to close this quarter and what that number is made of.
Amolino forecast
$3.9M
$-1.6M last 7 days
| Category | Amount | Base | Peak | Description |
|---|---|---|---|---|
| Closed won | $1.3M | $0 | $1.3M | Won opportunities |
| Confident | $2.5M | $1.3M | $3.8M | Opportunities that are most likely to be won |
| Worst case | $3.8M | $0 | $3.8M | Pessimistic forecast: won opportunities + most likely to be won |
| Upside | $29.5K | $3.8M | $3.9M | Opportunities with reasonable likelihood to be won |
| Forecast | $3.9M | $0 | $3.9M | Most accurate forecast |
| Accelerator | $271.2K | $3.9M | $4.1M | Opportunities that, with more effort, could be won |
| Best case | $4.1M | $0 | $4.1M | Optimistic forecast |
Tap a category to see its details and what it includes.
Hover over or tap a bar for details. Click a bar, Best case or Worst case to see which categories it includes.
The large number (for example $3.9M) is your Amolino forecast for the selected quarter and pipeline.
The figure next to it (for example $-1.6M last 7 days) shows how much the forecast has moved over the past week. Red means it went down; green means it went up. To see which deals caused the change, open Forecast updates.
Amolino puts every opportunity into a forecast category. The category is based on what is happening on the deal, such as recent emails and meetings, how engaged the buyer is, and whether the close date keeps moving. It doesn't rely on the stage a rep entered by hand.
| Category | What it means |
|---|---|
| Closed won | The deal has already been won. |
| Confident | Amolino expects this deal to close this quarter. |
| Upside | The deal could close this quarter, but there are signs it may slip. |
| Accelerator | The deal is currently off track for this quarter, but it could still be won with extra effort. These are the deals to push on if you need to close a gap. |
| Unlikely | Amolino doesn't expect this deal to close this quarter. |
| New | The opportunity is too new for Amolino to assess yet. |
| Lost | The deal has been lost. |
You can see each opportunity's category in the Amolino forecast column of the opportunity list.
Amolino adds categories together to give you three numbers:
| Number | Includes |
|---|---|
| Worst case | Closed won + Confident |
| Forecast | Closed won + Confident + Upside |
| Best case | Closed won + Confident + Upside + Accelerator |
Unlikely, New and Lost opportunities are not counted in any of the three.
The Best case and Worst case totals are shown in the bar above the chart. Click either one to filter the opportunity list to just the deals that make up that number. See Opportunities and filters.
The chart is a waterfall. Reading from left to right, it builds the forecast one category at a time:
- Closed won: revenue already won.
- Confident: stacks on top of Closed won.
- Worst case: the running total so far (Closed won + Confident).
- Upside: stacks on top of the worst case.
- Forecast: the running total (worst case + Upside).
- Accelerator: stacks on top of the forecast.
- Best case: the final total (forecast + Accelerator).
Solid bars (Closed won, Confident, Upside, Accelerator) are the amount each category adds. Striped bars (Worst case, Forecast, Best case) are running totals.
The dark horizontal line marks your target for the quarter, for example Target: $10M. The distance between the bars and the line shows how far you are from target. To change the target, see Setting forecast targets.
Bar details
Hover over any bar to see its details:
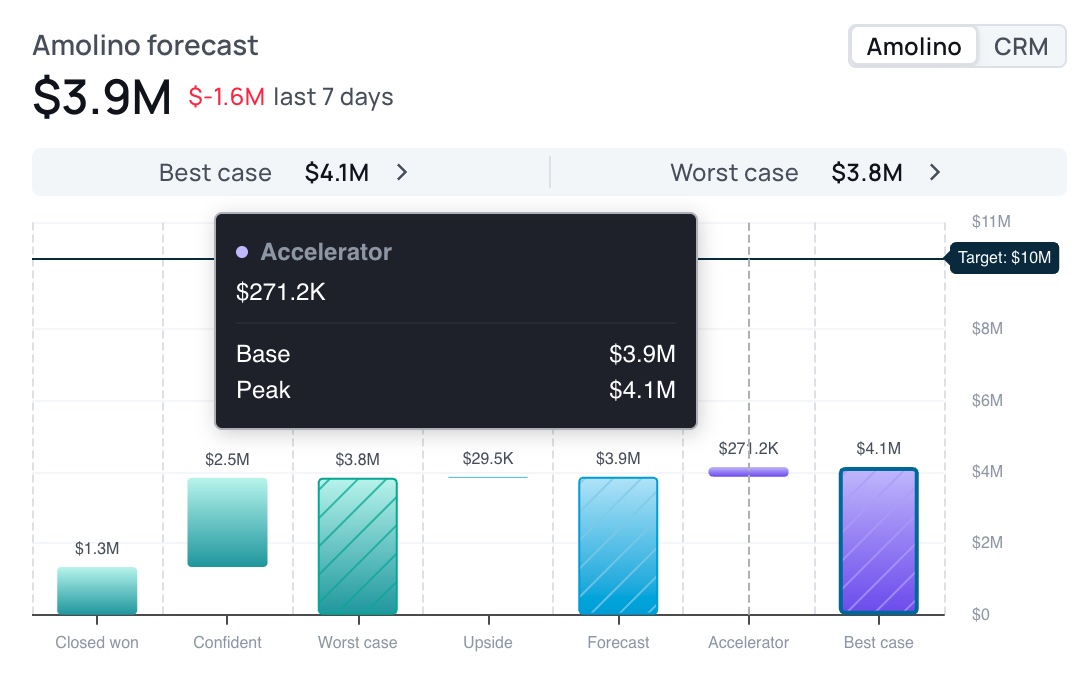
- The value is the amount that category adds (for example, Accelerator adds $271.2K).
- Base is where the bar starts: the running total before this category.
- Peak is where the bar ends: the running total after this category.
In the example above, Accelerator deals would take the forecast from $3.9M (base) to a best case of $4.1M (peak).
Related Articles
Forecast Dashboard Overview
A tour of the Forecast dashboard: what it shows, how to pick a quarter and pipeline, and where to go next.
Setting Forecast Targets
Set quarterly revenue targets for each pipeline and track attainment on the Forecast dashboard.