Help Article
Forecast Dashboard Overview
A tour of the Forecast dashboard: what it shows, how to pick a quarter and pipeline, and where to go next.
The Forecast dashboard shows how much revenue your team is likely to close in a quarter. It also shows how that number is changing and which opportunities make it up. Amolino builds this forecast for you from the activity on each deal, so you don't have to collect a commit call from every rep.
- Sign in to Amolino.
- In the left sidebar, under Dashboard, click Workspace.
- Click the Forecast tab at the top of the page.
The Manager and Sales rep tabs next to it show other views of your pipeline. This guide covers only the Forecast tab.
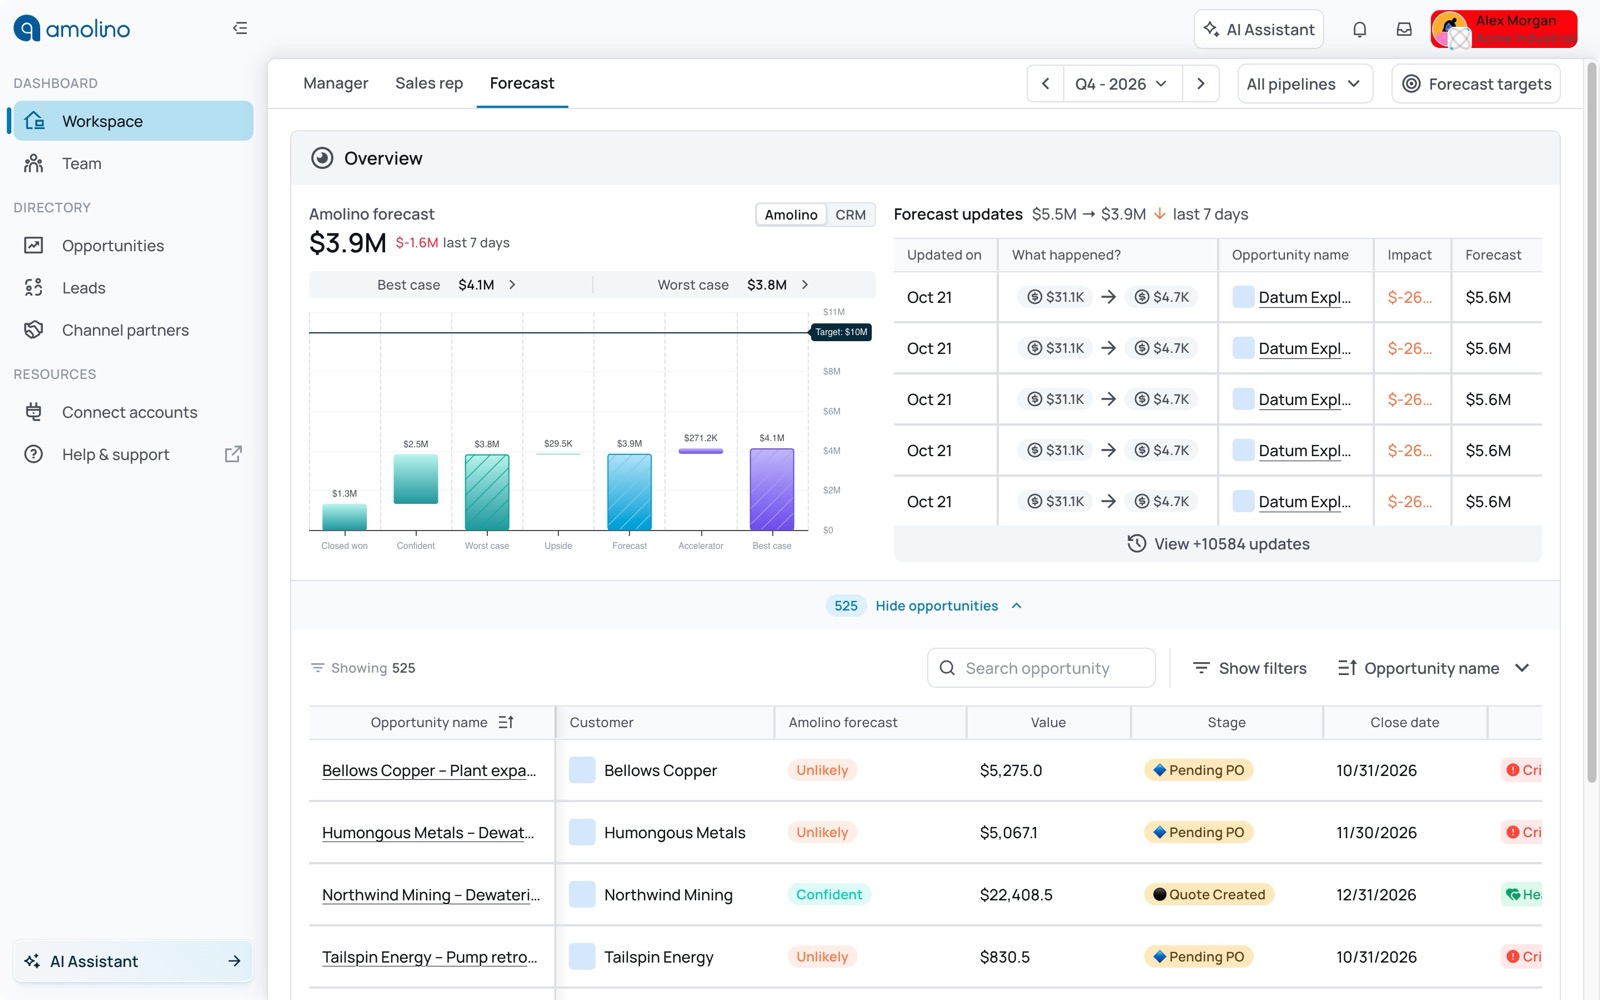
The dashboard has three main areas:
| Area | What it shows |
|---|---|
| Amolino forecast (top left) | Your forecast total for the quarter, how much it moved in the last 7 days, the best and worst case, and a chart that breaks the number down by forecast category. See Understanding the forecast chart. |
| Forecast updates (top right) | The latest changes to opportunities in the forecast, such as a new value or a new close date, and how each one moved the forecast. See Forecast updates. |
| Opportunities (bottom) | Every opportunity in this forecast, which you can search, sort and filter. See Opportunities and filters. |
Use the controls in the top-right corner to choose what the dashboard shows.

Quarter
The dashboard opens on the current quarter. To see a different one:
- Click the ‹ or › arrows to step back or forward one quarter, or
- Click the quarter name (for example Q4 - 2026). Use the arrows next to the year to change the year, then pick a quarter.
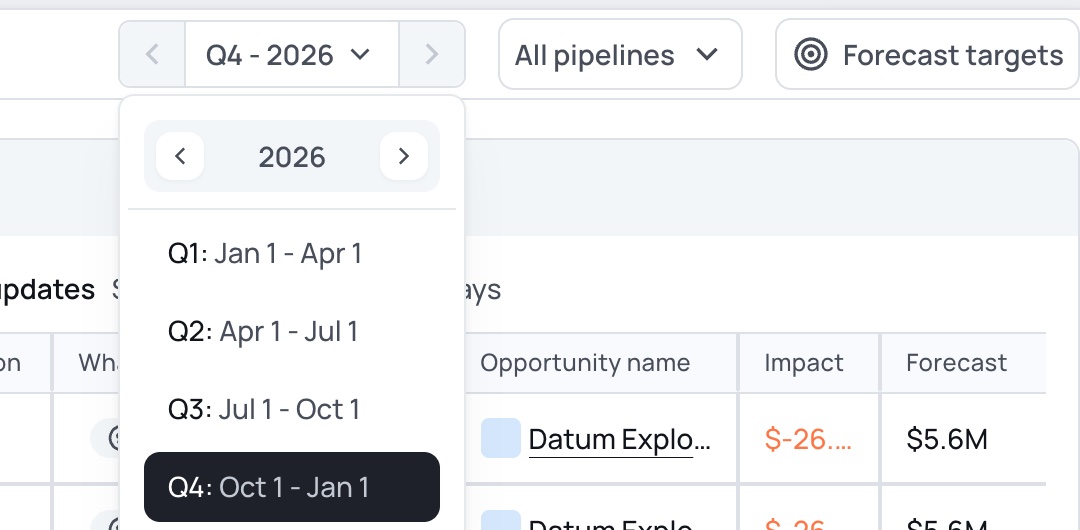
Each quarter lists its date range. For example, Q4: Oct 1 - Jan 1 covers October 1 through December 31. An opportunity counts toward a quarter when its close date falls inside that range.
The quarter and year you pick are saved in the page address. You can bookmark the page or share the link with a teammate, and they'll see the same quarter.
Pipeline
If your CRM has more than one pipeline, use the All pipelines menu to look at just one of them. The forecast, chart, updates and opportunity list all change to match. Choose All to go back to the combined view.
Forecast targets
Click Forecast targets to see or set the revenue target for each pipeline and quarter. The target appears as a line across the forecast chart. See Setting forecast targets.
The Amolino / CRM switch above the chart lets you change which forecast you're looking at:
- Amolino (the default) is the forecast Amolino builds by looking at what is actually happening on each deal.
- CRM is based on the forecast categories your reps set in your CRM. Its chart uses your CRM's categories: Pipeline, Not forecasted, Commit, Closed won, Best case and Forecast.
Comparing the two shows where your reps' view of a deal differs from the evidence Amolino sees.
If the CRM forecast shows $0, Amolino didn't find a forecast category on your opportunities in the CRM. Check that your reps fill in the forecast category field and that your CRM is connected under Connect accounts.
Related Articles
Understanding the Forecast Chart
What the Amolino forecast number means, how forecast categories work, and how to read the best case, worst case and forecast chart.
Setting Forecast Targets
Set quarterly revenue targets for each pipeline and track attainment on the Forecast dashboard.