Help Article
Setting Forecast Targets
Set quarterly revenue targets for each pipeline and track attainment on the Forecast dashboard.
Forecast targets are the revenue goals for each pipeline in each quarter. Once you set a target, it appears as a line across the forecast chart, so you can see at a glance how close your forecast is to the goal.
- Open the Forecast tab of your dashboard.
- Click Forecast targets in the top-right corner.
A panel opens with the targets for the current fiscal year.
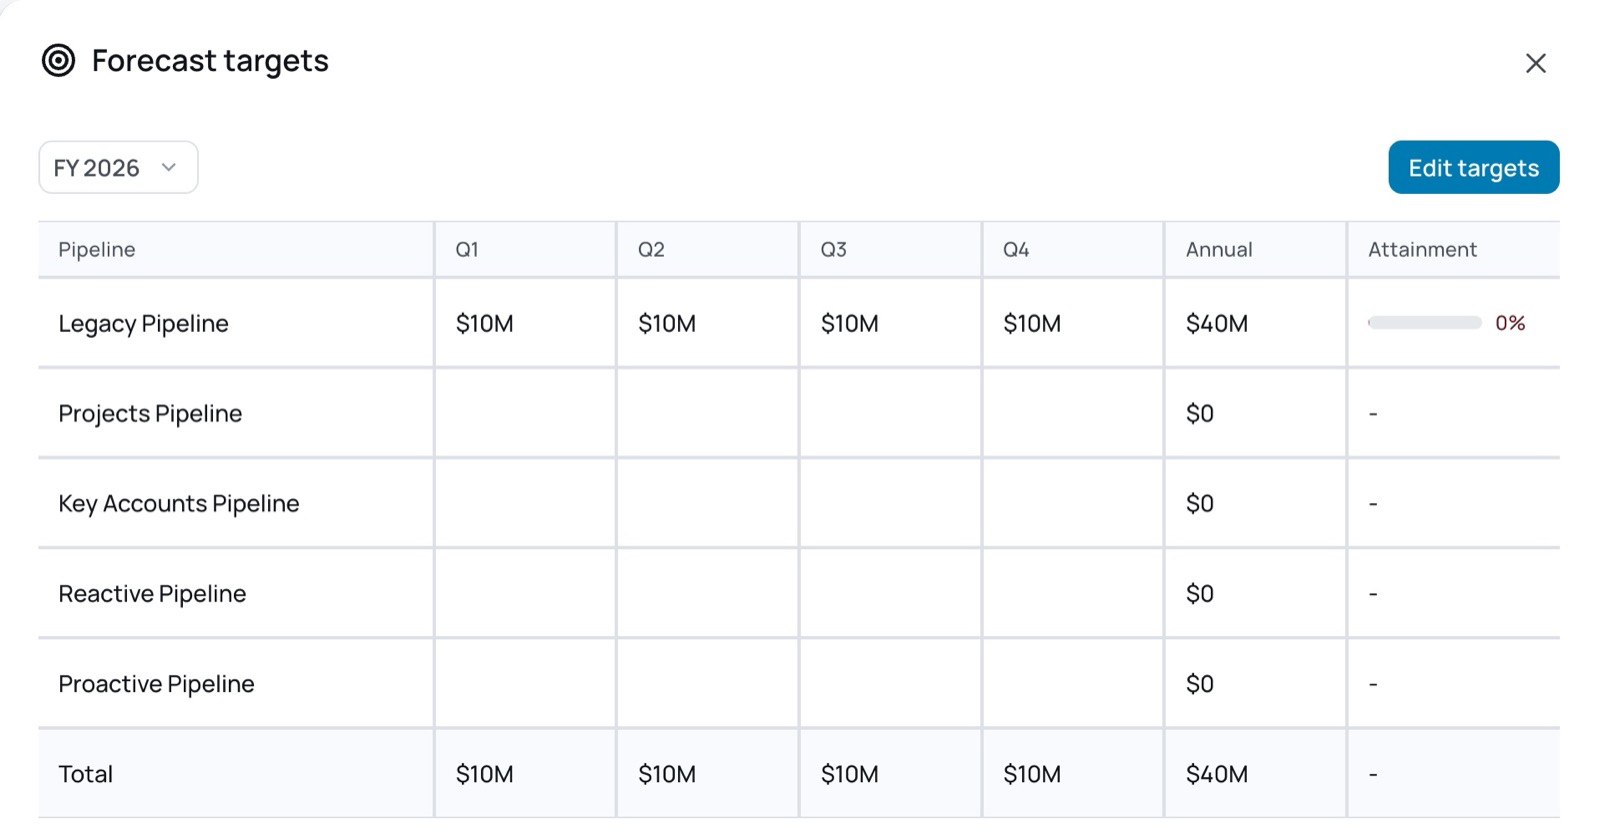
| Column | What it shows |
|---|---|
| Pipeline | Each pipeline in your CRM. |
| Q1 – Q4 | The target for each quarter. A blank cell means no target has been set. |
| Annual | The total of the four quarterly targets. |
| Attainment | How much of the annual target has been closed so far, shown as a percentage. A dash (-) means there is no target to measure against. |
The Total row adds up every pipeline.
To look at another year, use the FY menu in the top-left corner of the panel.
- In the Forecast targets panel, click Edit targets.
- Enter a target in each quarter you want to set. Leave a cell blank if a pipeline has no target for that quarter.
- Save your changes.
The chart updates to show the new target line.
Depending on your role, you may not be able to edit targets. If Edit targets isn't available, ask an Amolino admin in your organization.
When All pipelines is selected, the chart shows the total target for the quarter. When you pick a single pipeline, it shows that pipeline's target.
Related Articles
Forecast Dashboard Overview
A tour of the Forecast dashboard: what it shows, how to pick a quarter and pipeline, and where to go next.
Understanding the Forecast Chart
What the Amolino forecast number means, how forecast categories work, and how to read the best case, worst case and forecast chart.