Help Article
Forecast Updates
See which deal changes moved your forecast, by how much, and when.
When your forecast moves, you want to know why. Forecast updates lists each change to an opportunity in the forecast and shows how much it moved the total.
The panel sits in the top right of the Forecast dashboard and shows the most recent changes.
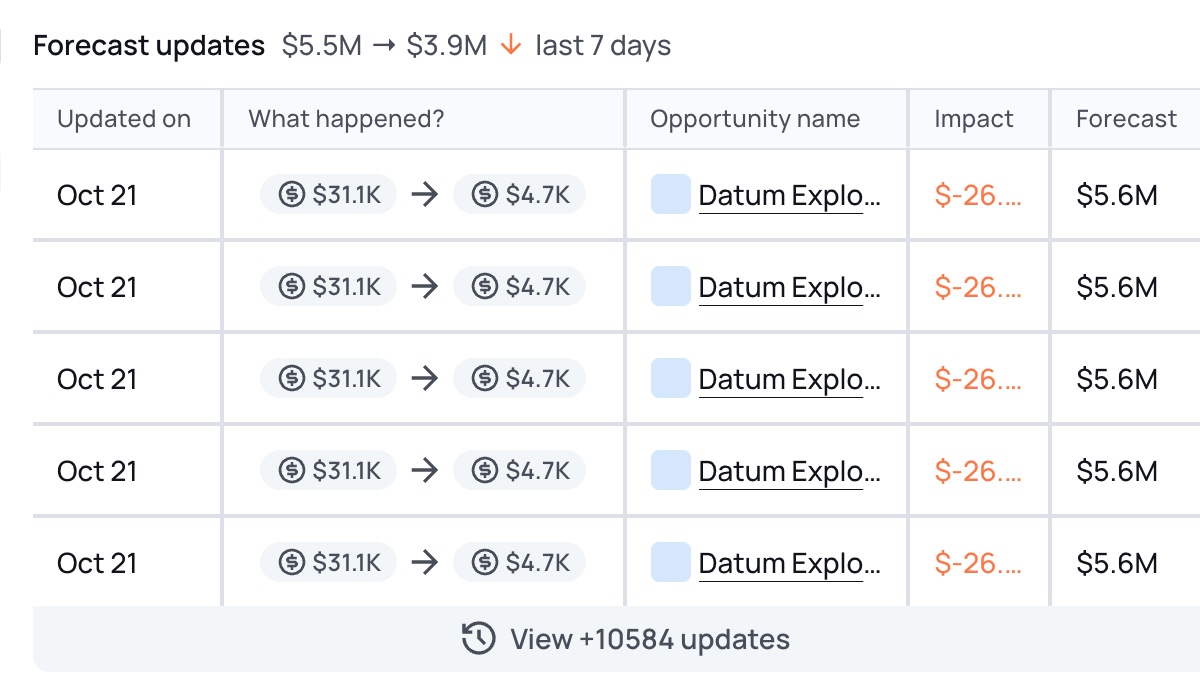
The heading sums up the past week. For example, $5.5M → $3.9M ↓ last 7 days means the forecast was $5.5M seven days ago and is $3.9M now.
Each row is one change to one opportunity:
| Column | What it shows |
|---|---|
| Updated on | The date the change happened. |
| What happened? | The old value on the left and the new value on the right. A calendar icon means the close date changed; a dollar icon means the deal value changed. |
| Opportunity name | The opportunity that changed. Click the name to open it in a new tab. |
| Impact | How much this change moved the forecast. Green (+) increased it; red (-) reduced it. |
| Forecast | The forecast total right after this change. |
Common changes
- Value changed: the deal amount went up or down, for example $31.1K → $4.7K.
- Close date moved: the deal's expected close date changed, for example 8/13/26 → 10/21/26. If the new date moves a deal into or out of the selected quarter, it's added to or removed from the forecast.
Click View +N updates at the bottom of the panel to open the full list for the selected quarter. The list scrolls and shows every update to opportunities closing in that quarter, newest first.
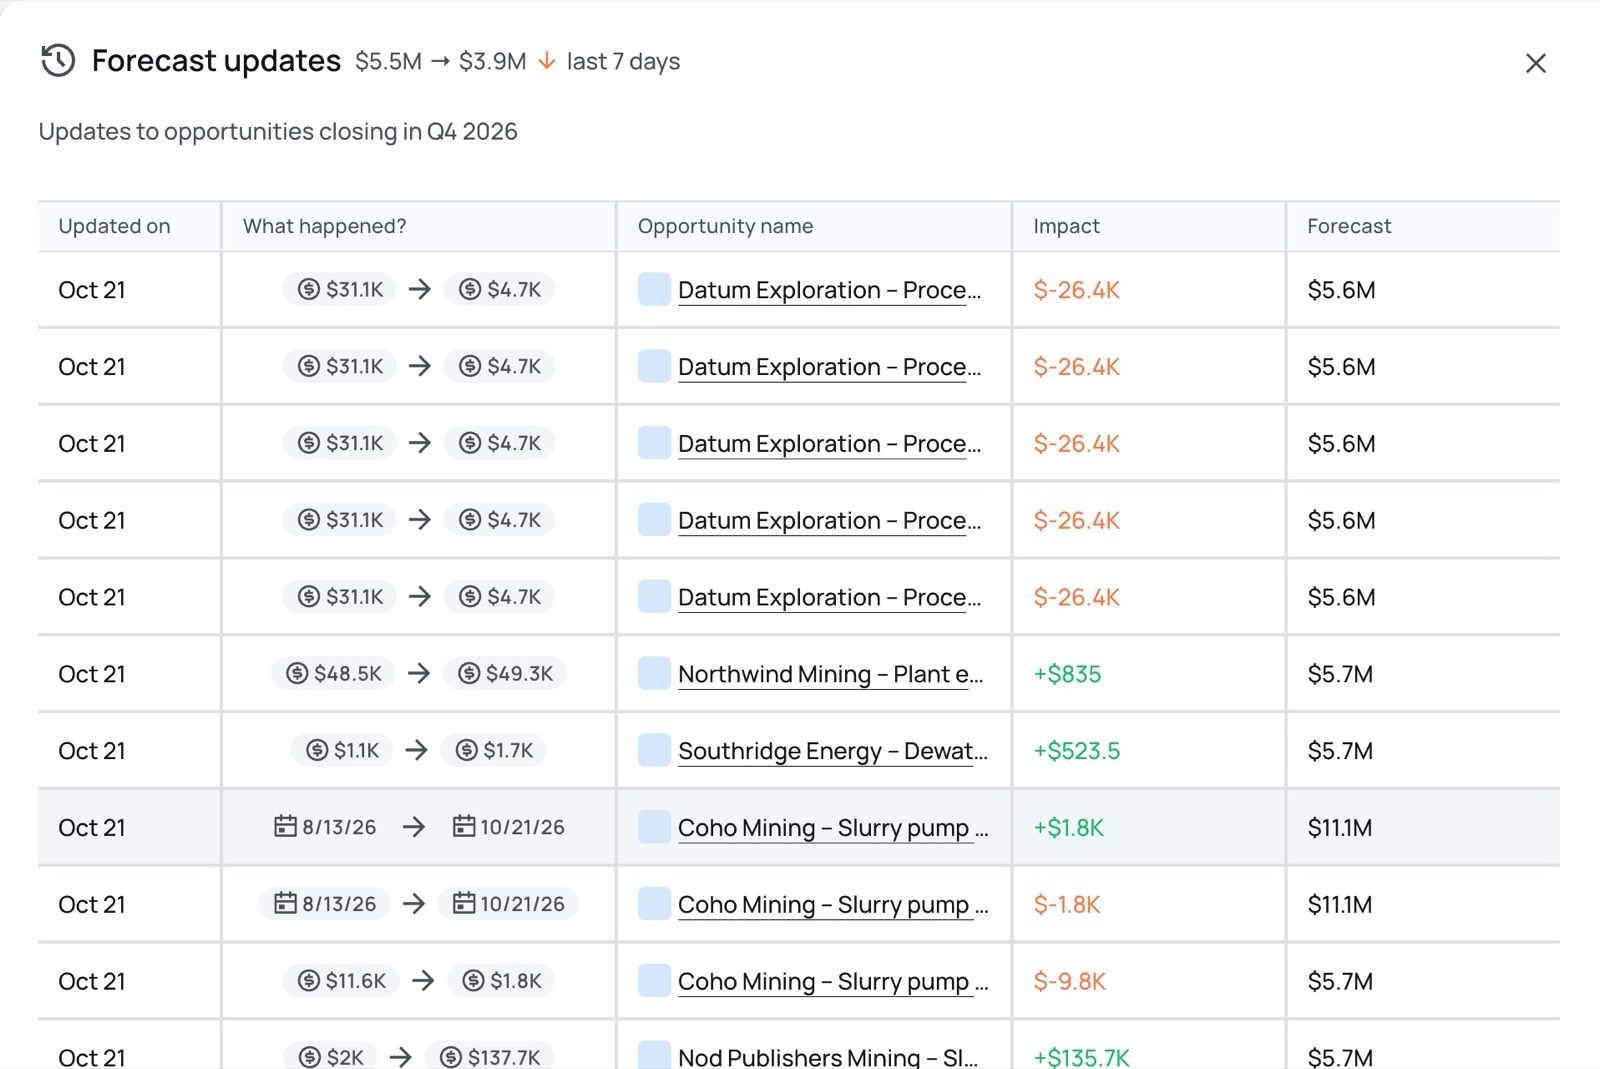
Close the list with the × in the top-right corner.
- After a big drop in the forecast, check here first to find the few deals that caused it.
- If the same opportunity appears many times, it has been edited often. That can mean the deal is unstable and worth a closer look.
- Pick a single pipeline in the All pipelines menu to see updates for that pipeline only.
Related Articles
Forecast Dashboard Overview
A tour of the Forecast dashboard: what it shows, how to pick a quarter and pipeline, and where to go next.
Understanding the Forecast Chart
What the Amolino forecast number means, how forecast categories work, and how to read the best case, worst case and forecast chart.
Setting Forecast Targets
Set quarterly revenue targets for each pipeline and track attainment on the Forecast dashboard.